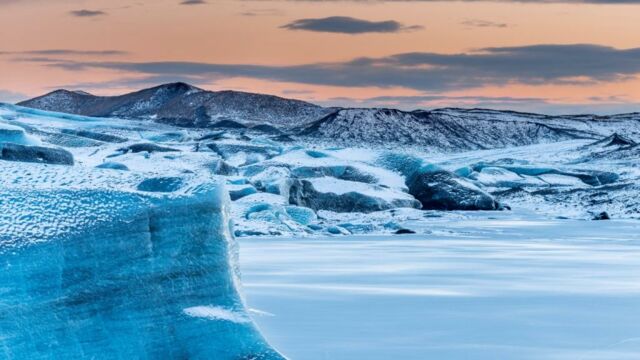
NASA, in collaboration with the European Space Agency (ESA), released a video of icebergs in Antarctica. The video is an animated creation made by scientific animators at Pixel Movers and Makers. It gives us a detailed look at the breakup and drift of antarctic glaciers recorded over the last 40 years in October 2019.
Discover our latest podcast
The animated video is only a few seconds long. It shows the surprising increase in the number of fractures that took place over nearly half a century.
An alarming discovery
Animators Kevin Pluck and Marlo Garnsworthy of Pixel Movers and Makers were enthused to reveal their video to the world. The video showed over 40 years of collected data and observations in just a few seconds. The information was gathered from 1976 to 2017. The video allowed us to see the irreparable damage that had been done to the glaciers due to the deteriorating global ecosystem. The video highlights the disintegration of the Larsen Ice Shelf in 2002 and the journey of the B-15 iceberg, the largest iceberg on record (11,000 square kilometres), which broke off from the Ross Ice Shelf in 2000.
The antarctic region lost over 40% of its ice over the last 40 years. This is a very alarming situation, says Garnsworthy.
I was both surprised and not quite surprised to see an increase in the flow of icebergs in recent years.
Teaser Trailer II
— Kevin Pluck (@kevpluck) November 10, 2018
The Larsen B and Wilkins collapse is spectacular! pic.twitter.com/wBR9bjCOgM
The severe consequences
The icebergs shown in the animation are those large enough to be detected by these devices. When they break off, they usually rotate counter-clockwise around Antarctica before travelling along the 'Iceberg Alley' to the Antarctic Circumpolar Current. From then on, they are left to their own devices in the ocean, eventually melting and adding to the volume of the water.
Understanding the mechanisms that lead to this massive loss of ice is crucial to preventing many coastal cities from being left with their heads underwater in the coming decade. The data used to make this video was collected by the Antarctic iceberg monitoring database managed by Brigham Young University (USA). The database collects measurements from six satellites equipped with scatterometers, which are used to track objects on the Earth's surface.
This article has been translated from Gentside FR.
Read more:
⋙ These Countries Could Be Uninhabitable By 2070 Because Of Global Warming
⋙ Chocolate Could Disappear Within the Next 30 Years Due to Global Warming


